Crestwood High School Weather Station
When and why was the weather station purchased and installed?
The Crestwood High School weather station was purchased and installed in 2013 as a joint purchase between the Crestwood School Board, the National Honor Society, and the Science Club. Each group provided funds for the purchase and installation (which totaled about $16,000 at the time.)
The weather station is located on the roof of the southwest corner of the new science wing (formerly the auto shop.) It is accessible for maintenance through an interior ladder that goes to the roof.
A major reason for the support of this purchase was the need for hyperlocal weather data to be certain all outdoor activities (sports, outdoor graduation, etc.) were conducted under safe conditions.
Board personnel also wanted immediate notification of severe weather warnings that could affect student safety and well-being when school is in session.
Another important purchase objective was to support weather and climate instruction within the Crestwood High School science curriculum and longitudinal student research projects.
Where data collected goes:
The data generated by our weather station is collected by the company Weather Networks and is used to help generate hyperlocal and regional weather forecasts.
The data is also directly sent to the GLOBE Program where NASA and other scientists worldwide use this data to conduct research and to validate information received from up on high by satellites. Our weather station senses near surface conditions in the atmosphere and satellites look down to collect information from higher up as they orbit around the Earth.
How is the weather data reported?
The “WeatherBug” app (free version) is available on whatever app store you get your apps on.
Get the WeatherBug app
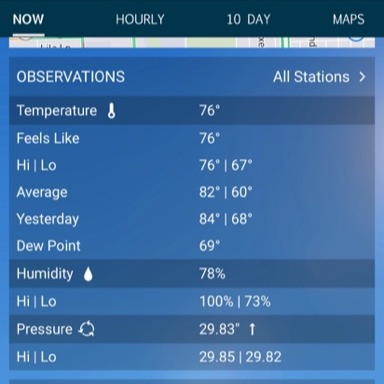
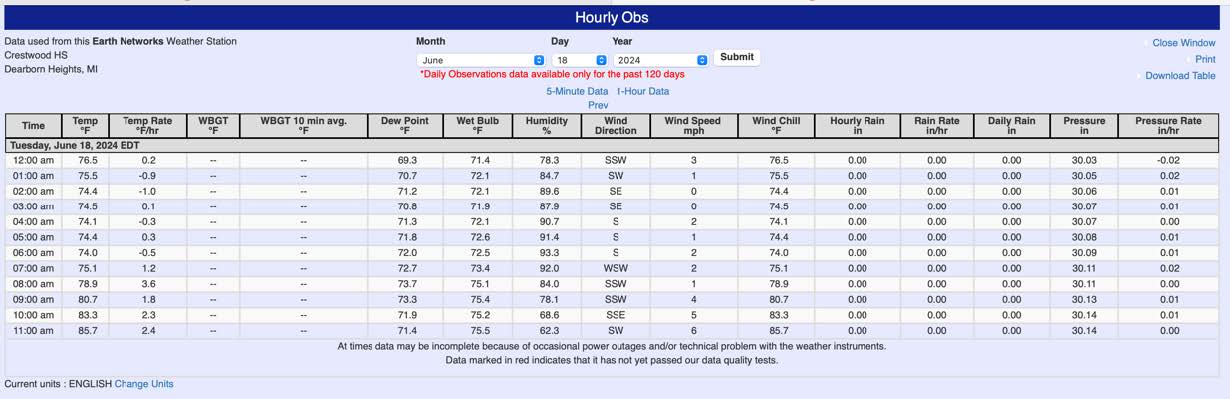
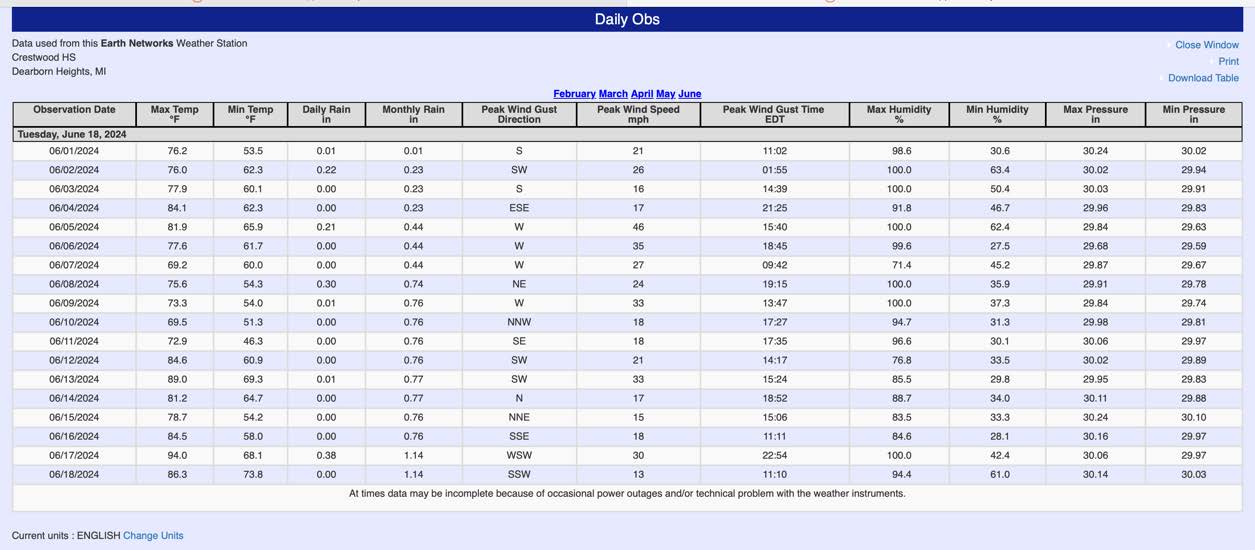
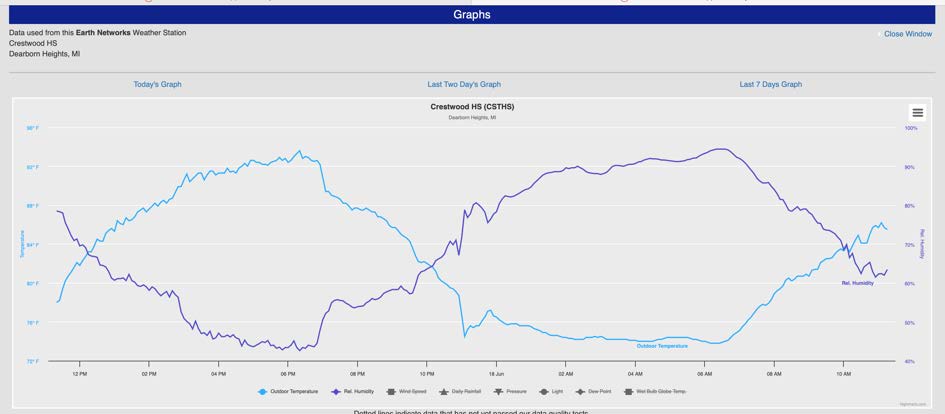
Our weather station data that is pushed to Weather Networks can be viewed directly on the app (see examples below:)
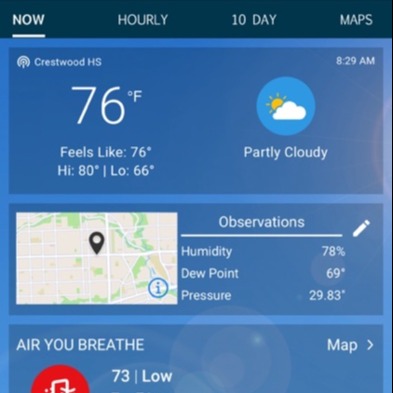
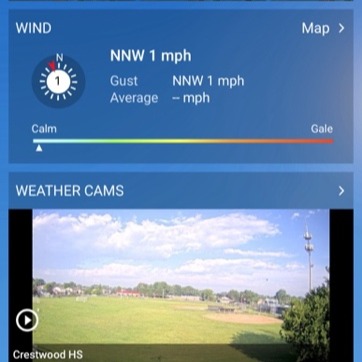
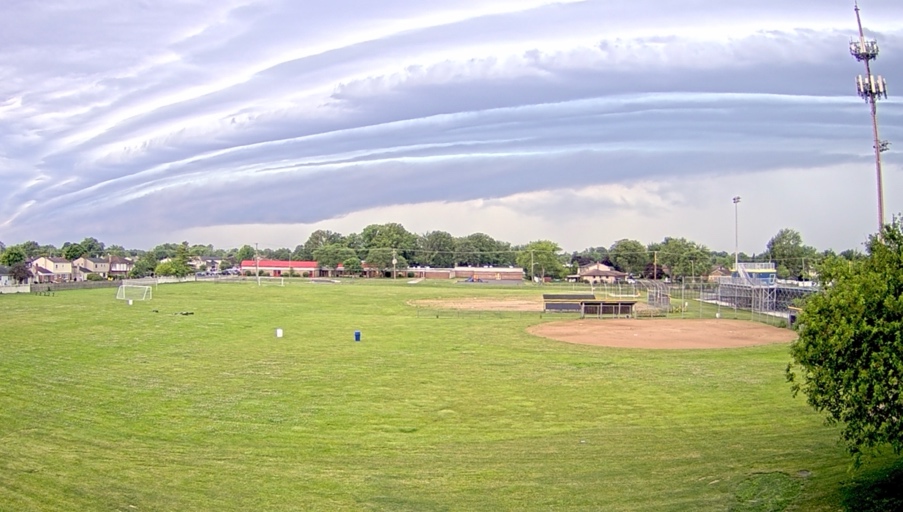
Notice above that the weather HD camera is facing Southwest as most of our weather comes to us due to the prevailing southwesterlies.
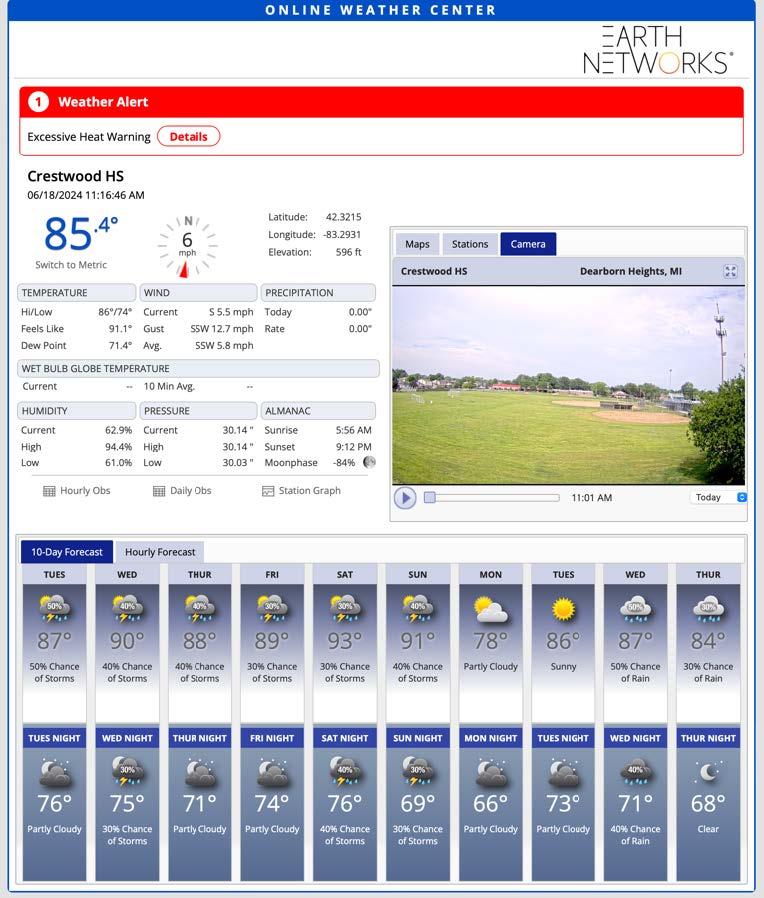
This data is also viewable by going directly to:
https://owc.enterprise.earthnetworks.com/OnlineWeatherCenter.aspx?stat=CSTHS&pid=3
Weather data is collected every 5 minutes and can be viewed daily, monthly, and graphs of various weather parameters can be generated. The data can be displayed in either English or Metric. We used this data along with what we collected with other devices on April 8, 2024 to help monitor the changes that took place before, during, and after the near completed solar eclipse.
Crestwood students have made phenomenal use of this data and it has propelled them to conduct a
variety of research projects that have depended heavily on the data generated by our weather station.
We have won local, regional, national, and international symposiums and competitions as a result of our
student’s use of this data.
Because of the 24-hour HD video cam, severe weather can be documented, like this rare image of a roll
cloud that was captured during a severe weather event.
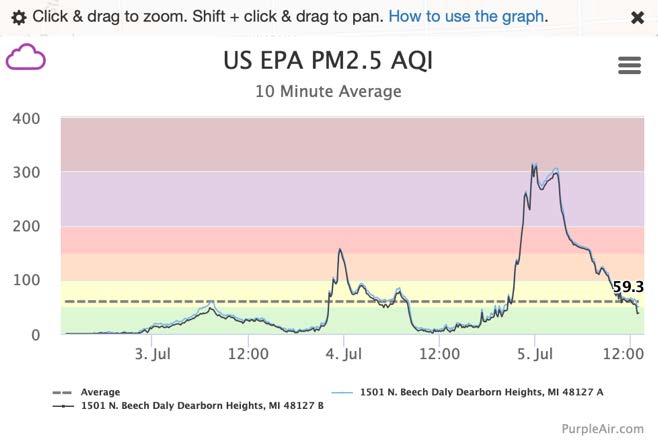
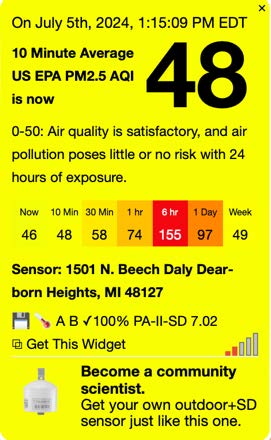
We have another important atmospheric monitoring device! What is PurpleAir?
PurpleAir is a particulate matter sensor we have installed in our school’s main courtyard. It collects data
on the size of particles that we inhale and cause the most damage to our lungs (PM10 and PM2.5). This is
additional data that can be used to advise students and staff of potentially hazardous air conditions that
could impact their health.
The data collected by this device is stored to a microSD card and can later be extracted for students
conducting air quality investigations. A sample of this data is shown below, note the high particulate
counts that occurred after 4th of July fireworks and the subsequent poor air quality afterwards. We show
up online on the PurpleAir map (we show 19 on the map in the image to the right below).
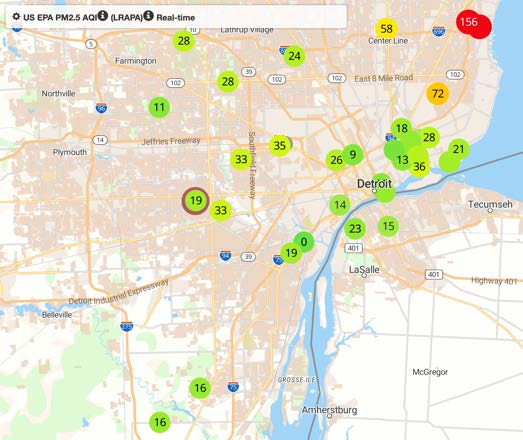
Again, this is hyperlocal data that can be used to help monitor the health and welfare of our students that
might be outside at recess or participating in outdoor sports activities.